
Violence Against Educators & Support Staff: What the Data Shows
Student-aggression injuries to teachers, education assistants, and special-education staff across the United States, Canada, Australia & New Zealand.
Across the English-speaking world, a quiet workplace-safety problem plays out in classrooms every day: educators — and the education assistants who support students with the highest needs — are hit, kicked, scratched, and bitten at work. It is too often treated as “part of the job.” The data says it shouldn’t be.
This page compiles the most credible, independently verifiable statistics we could find on student-aggression injuries to school staff in four countries. We prioritise government and peer-reviewed sources and attribute union surveys as such. Because nearly every dataset relies on reported incidents, the true numbers are higher — every figure here is a conservative floor.
The people most at risk aren’t who most people picture. In a peer-reviewed analysis of Minnesota school workers’-compensation data, special-education assistants were injured by students at roughly six times the rate of licensed teachers — the highest injury rate of any staff group.
United States
Federal data shows teachers face workplace violence at about twice the rate of the average worker.
Canada
Education has become one of Canada’s most dangerous sectors for workplace violence. In British Columbia, education recorded the second-highest number of accepted workplace-violence claims of any sector from 2013 to 2022 — behind only health care and social services (WorkSafeBC).
Australia & New Zealand
A peer-reviewed analysis of Australian workers’-compensation claims found injury rates were highest among special educators and education aides, with assault-related claims concentrated in those same special-education roles (Gray et al.).
Who is most at risk: education assistants & special-education staff
A consistent pattern runs through the strongest data on both sides of the Pacific: the staff most likely to be injured aren’t teachers in general, but the education assistants, aides, and special-education staff who work most closely with students who have complex behavioural needs. The peer-reviewed Minnesota data put special-education assistants at the highest injury rate of any group (4.54 per 100 full-time staff), and in districts serving primarily special-education students the risk of a lost-time injury was nearly ten times that of typical staff. Australian compensation data points the same way.
On biting, and the everyday reality
No government or peer-reviewed dataset we found isolates biting as its own number — incidents are recorded under “physical violence” or “assault.” But biting recurs in how staff describe the work: the Ontario study lists being hit, kicked, scratched, bitten and spat at among routine experiences. For staff supporting students with self-injurious or aggressive behaviours, bites, scratches and grabs to the arms and hands are among the most common injuries.
Why the real numbers are higher
Every figure here depends on incidents being reported — to an employer, a workers’-compensation system, or a survey. Researchers across all four countries note that many never are, often because staff have come to see them as normal. These statistics understate the problem. They are floors, not ceilings.
What reduces the risk
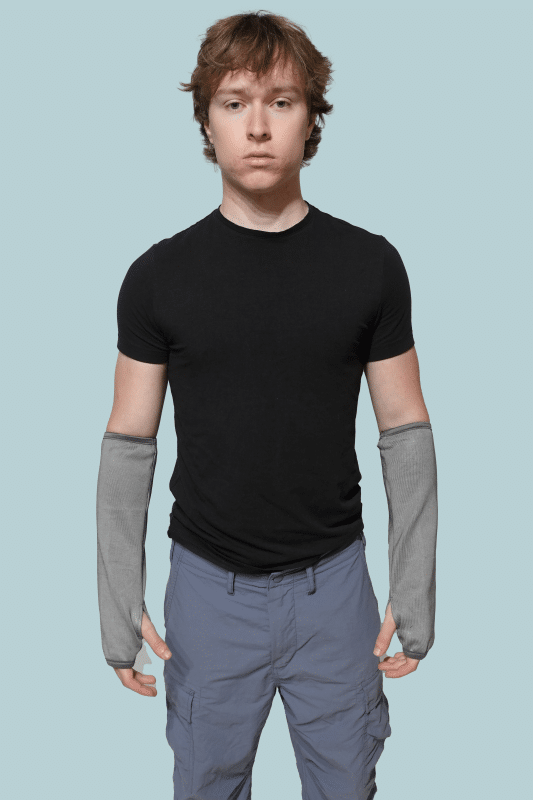
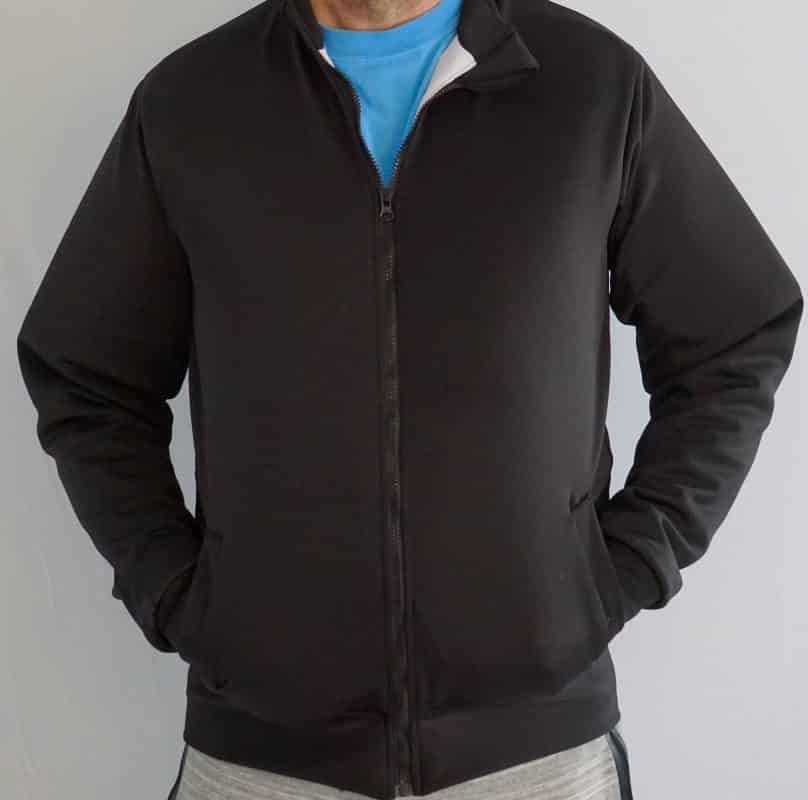
There is no single fix. The evidence points to a layered approach: adequate staffing and training, behaviour-support and de-escalation plans, prompt reporting — and, for staff in the highest-risk roles, personal protective equipment matched to the actual injuries they face. Where bites and scratches to the arms are common, bite- and cut-resistant arm guards and protective clothing designed for classroom and therapy settings let staff keep supporting students safely.
Sources
- Schofield et al., special-education staff injury risk, Minnesota workers’ compensation (peer-reviewed, Injury Prevention/BMJ).
- U.S. Bureau of Labor Statistics, violence against school teachers and workplace violence, 2021-22.
- U.S. National Center for Education Statistics, teachers threatened or attacked by students, 2020-21.
- WorkSafeBC workplace-violence claims by sector (reported by CBC).
- University of Ottawa / CUPE, “In Harm’s Way” (self-selected union survey, 2018-19) and 2025 CUPE survey.
- Gray et al., Australian education-sector injury claims (peer-reviewed).
- Australian Principal Occupational Health, Safety & Wellbeing Survey (AITSL national strategy).
- Rahimi et al., violence against New Zealand primary teachers (peer-reviewed, 2023).
Figures reflect the most recent data available from each source and are presented as conservative floors given known under-reporting. Union-survey figures are self-selected and attributed accordingly. Last reviewed June 2026.